Philippines’ Continuous Industrialization: Effect on Water Quality and Supply
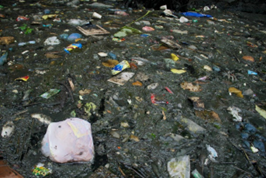
Figure 1. A part of Marilao River, part of the Marilao-Meycauayan-Obando River System (MMORS) and one of the world’s most polluted river. Photo from the Philippine Center for Investigative Journalism (2019)6
Introduction
According to the assessment made by the Water Environment Partnership in Asia (WEPA), there are 820,253 industrial establishments in the Philippines, and 60% of these are within the Manila Bay Region, which is comprised of Metro Manila, Region 3, and Region 4-A. Among the industrial establishments, 112,789 are manufacturing industries, mainly1:
- Pulp and paper mills
- Sugar mills
- Alcohol distilleries
- Food processing
- Plastic and consumer goods
- Copper smelters
- Glass plants
- Steel mills
- Cement plants
- Electronics assembly
- Aerospace
- Textiles
- Petroleum refining
- Shipbuilding
The Philippines is a developing country, and the growth of the industrial sector may impact the state of the water pollution and supply of the Philippines.
Water Pollution from Industrial Sources
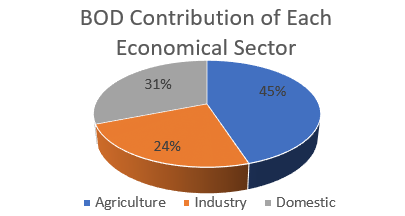
Figure 2. BOD contribution of each sector. Adapted from the Environmental Management Bureau (EMB) National Water Quality Status Report 2006-20132.
Based on the Biological Oxygen Demand (BOD) contribution of each economical sector, the agricultural and domestic sectors are the greatest contributors of water pollution according to the Environmental Management Bureau (EMB) National Water Quality Status Report2 (Figure 2). The volume of industrial wastewater discharge is lower compared to domestic and agricultural discharges; however, the detrimental environmental impact of industrial effluents is greater due to the nature and composition of the wastewater. Industrial effluents may contain detergents, heavy metals, surfactants, oils, solid wastes, and hazardous chemical wastes1,3. Additionally, BOD only measures organic wastes – other industries produce inorganic wastes, such as heavy metals, which are not publicly available data3.
Class C, D, SC, and SD water bodies are where most industrial wastewaters are discharged as stated in the DENR Administrative Order No. 2016-083–5 (Table 1). Table 1 also describes the effluent standards for each water body classification.
Table 1. Water Classification and Effluent Standards for BOD. Adapted from the DENR Administrative Order No. 2016-083–5.
| Classification | Intended Beneficial Use | Effluent Standards for BOD | Effluent Standards for BOD (mg/L) Applicable to Establishments with Influent BOD of: | |||
|---|---|---|---|---|---|---|
| 3,000 to <6,500 | 6,500 to <10,000 | 10,000 to <30,000 | >30,000 | |||
| Class C (Freshwater) | 1.) Fishery Water for the propagation and growth of fish and other aquatic resources
2.) Recreational Water Class II – For boating, fishing, or similar activities
3.) For agriculture, irrigation, and livestock watering |
50 | 100 | 200 | 600 | 900 |
| Class D (Freshwater) | Navigable waters | 120 | 150 | 300 | 1,000 | 1,500 |
| Class SC (Marine) | 1.) Fishery Water Class III – For the propagation and growth of fish and other aquatic resources and intended for commercial and sustenance fishing
2.) Recreational Water Class II – For boating, fishing, or similar activities
3.) Marshy and/or mangrove areas declared as fish and wildlife sanctuaries |
100 | 100 | 200 | 600 | 900 |
| Class SD (Marine) | Navigable waters | 150 | 150 | 300 | 1,000 | 1,500 |
In 2007, Marilao-Meycauayan-Obando River System (MMORS), a class C water body, is ranked as one of the world’s dirtiest rivers by the Blacksmith Institute, a New York-based non-profit organization3,6. The MMORS runs through Bulacan, a province in Region 3, and ultimately discharges to Manila Bay (Figure 3). DENR declared the MMORS as a Water Quality Management Area (WQMA) in 2008 to help with its rehabilitation. There are 567 registered business establishments in Bulacan, and taking into consideration the unregistered or backyard gold smelters, the wastewater released from these industries pollute the MMORS. From the average BOD of effluents of 69 companies in Bulacan for 2014 obtained from the EMB Region 3, it can be seen that paper products and packaging companies are non-compliant with the DENR effluent standard for BOD3 (Table 2).
Table 2. Wastewater generation data for industries in Bulacan Province for 2014. Adapted from EMB Region 3 Report3.
| Industry | Average BOD of effluents from 69 companies (mg/L) |
|---|---|
| Paper products and packaging | 70.00 |
| Hotels, resorts, and condominiums | 50.00 |
| Others | 50.00 |
| Oil, chemicals, fertilizer, and soap | 45.50 |
| Construction materials | 44.00 |
| Agriculture | 43.75 |
| Recycling, waste management, and dumpsites | 43.75 |
| Textile and garments | 37.48 |
| Food and beverages | 37.35 |
| Automotive | 35.43 |
| Warehousing | 32.00 |
| Electronic parts and supplies | 28.00 |
| Hospitals | 26.00 |
| Commercial malls and markets | 25.85 |
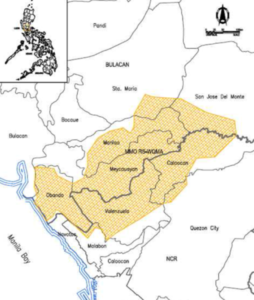
Figure 3. Map of the MMORS-WQMA (Marilao-Meycauayan-Obando River System – Water Quality Management Area)12.
Only the data for BOD of effluent is available, and 69 companies only represent a small part of the total industries in the area. Unfortunately, public access to other effluent pollution parameters of industries and establishments seems to be restricted3. In addition, data on the volume of wastewater generated by industries are limited as there is no national database collating all the data according to WEPA1. It was also mentioned by Rola et al. (2018) that industries send reports regularly; however, these are only stored in warehouses and are yet to be encoded3.
The Blacksmith Institute, in partnership with the Asian Development Bank (ADB) sampled the surface water, groundwater, sediment, and selected fishes and shellfishes along the Meycauayan river to set the baseline data for the heavy metal occurrence and level of the river system (Table 3). It was observed by the Blacksmith Institute that most of the sampling points exceeded the water quality guidelines set by DENR3. The project was completed in May 20097.
Table 3. Baseline heavy metal concentration along the Meycauayan river 3,5,8.
| Heavy Metal | Baseline Maximum Concentration Found (mg/L) | DENR Water Quality Guidelines for Class C Water Bodies (mg/L) |
|---|---|---|
| Arsenic | 0.07 | 0.02 |
| Cadmium | 0.06 | 0.005 |
| Copper | 0.15 | 0.2* |
| Chromium | 0.19 | 0.01 |
| Lead | 0.48 | 0.05 |
| Manganese | 40 | 0.2 |
| Mercury | 0.01 | 0.002 |
| Nickel | 0.82 | 0.2 |
| Zinc | 2.9 | 2 |
*Adapted from DENR Administrative Order No. 2021-19; from 0.02 mg/L dissolved copper (2016) to 0.2 mg/L total copper (2021)
Recent studies by Pleto et al. (2020) and Diwa et al. (2021) tested the heavy metal concentration of the soil and sediments along Meycauayan River. Since there are currently no government guidelines for heavy metal contamination in soils and sediments in the Philippines9,10, the maximum concentrations of the heavy metals in the Meycauayan River samples were compared with the standards developed by the National Oceanic and Atmospheric Administration (NOAA) for freshwater sediment quality (Table 4). Most of the samples taken exceed the severe level standard of NOAA. The severe effect level standard indicates that the concentration could potentially eliminate all benthic organisms living in the sediment and substrate11. It was also noted that the color of the water in the sample sites were either gray or black.
In the assessment of Diwa et al. (2021), mercury in the sediments was mostly from the backyard gold-smelting plants; lead was from the lead-acid battery recycling industries; chromium was from the tanneries; and nickel was from different industrial and commercial sources and the electroplating and stainless-steel industries10. Other heavy metals are generally utilized by most industrial or may come from sanitary landfill run-off as stated by Pleto et al. (2020)9. The most probable sources of the heavy metals are summarized in Table 5.
Table 4. Maximum heavy metal concentration in Meycauayan River as compared to the concentrations from the other rivers and lakes in the Philippines10.
| Heavy Metal | Maximum Concentration in Meycauayan River Sediments (mg/kg) | NOAA Standards for Freshwater Sediment Quality (Severe Effect Level, mg/kg) |
|---|---|---|
| Chromium | 375 | 110.0 |
| Lead | 947 | 250 |
| Nickel | 301 | 49.39 |
| Mercury | 0.61 | 0.47 |
| Zinc | 2256 | 820 |
| Copper | 877 | 110 |
| Manganese | 1695 | 1,100 |
| Chromium | 375 | 110 |
Table 5. Most probable source of the heavy metals found in the sediments in Meycauayan River10.
| Heavy Metal | Most Probable Source in Meycauayan River |
|---|---|
| Chromium | Tanneries |
| Lead | Lead-acid battery recycling industries |
| Nickel | Different industrial and commercial sources and electroplating and stainless-steel industries |
| Mercury | Backyard gold-smelting plants |
| Zinc, Copper, Manganese, Chromium | Most industries (formal and informal) and sanitary landfill run-off |
Heavy metals tend to accumulate in the soils and sediments in the substrate of the water bodies which may explain their extremely high concentrations. Heavy metals are also highly toxic, persistent, and are capable of bioaccumulating in animals and other biota9. These pollutants will continue to increase in concentration unless drastic actions are made.
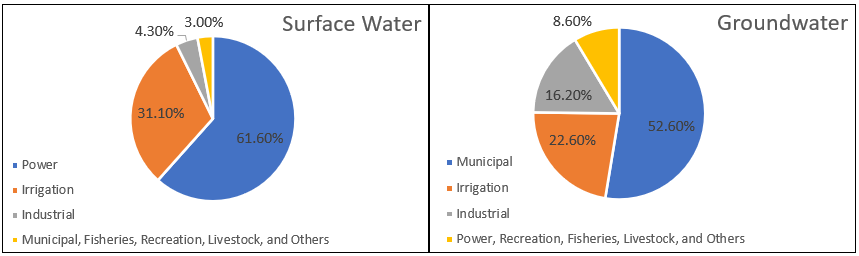
Figure 4. Percent Distribution of Surface Water and Groundwater as of 2019. Adapted from the Compendium of Philippine Environment Statistics 2010-2019 by the PSA13.
Water Allocation for Industrial Sources
As of 2019, most (61.1%) of the surface water allocation in the Philippines is for the power sector, while most (52.6%) of the groundwater allocation is for the municipal sector based on the data gathered by the Philippine Statistics Authority (PSA). Only 31.1% of the surface water is used for the industrial sector, while 16.2% is for groundwater (Figure 4). The industrial sector only uses a relatively small percentage of the surface and groundwater supply. In terms of amount of water usage, water shortage is less likely to be due to industrial activities since irrigation and domestic activities require a greater percentage of water from the total supply. In the event of a severe water shortage, the power and industrial sectors only come in the third and sixth priorities, respectively. In accordance with the Philippine Water Code, the municipal sector is the top priority, while irrigation is the second3.
The large consumption of surface water for the power sector is expected because hydroelectric power plants utilize large volumes of water. On the other hand, groundwater is used as the main drinking water source for more than half of the population in the Philippines, which explains the large municipal water allocation3.
The main causes of the depletion of the water supply in the Philippines are3:
- Contamination of groundwater due to pollution by domestic, agricultural, and industrial wastewater;
- Saline water intrusion due to excessive abstraction of groundwater;
- Informal users of domestic water are not accounted for in the overall computation of the country’s water supply and demand;
- Longer dry-spells due to climate change; and
- Rapid decline of forest cover causing soil run-off to add debris to surface water supply.
Although this report previously mentioned that the volume of industrial water usage would not affect the depleting water supply, the industrial sector can still affect the water supply indirectly due to wastewater discharge and utilization of materials from forests for their operations.
Conclusion
The industrial sector can cause severe damage to the state of the water quality of the water bodies in the Philippines and have an indirect effect on the water supply of the country. The MMORS is an example of how detrimental the lack of industrial effluent regulation enforcement and policy implementation are for water bodies. Some of the actions that need to be done for the improvement of the water bodies in the Philippines are: (1) creating pollution standards for the other environmental compartments, such as soils and sediments; (2) establishing or appointing a government body to constantly and strictly enforce and collate all the effluent data of industries; (3) regularly monitor contaminant levels of water bodies; and (4) immediately and consistently do remediation programs for severely polluted water bodies.
References
- Tuddao, V. B. & Gonzales, E. A. Situation of Industrial Wastewater Regulation in the Philippines. Water Environment Partnership in Asia, http://wepa-db.net/pdf/meeting/20200206/ws/06_Day1_PHL_WEPA%202020%20FINAL%20VERSION-%20SITUATION%20OF%20INDUSTRIAL%20WASTEWATER%20REGULATION%20IN%20THE%20PHILIPPINES.%20Dr.%20Vicente%20Tuddao%20Jr_.pdf (2020).
- Environmental Management Bureau. National Water Quality Status Report 2006-2013., https://emb.gov.ph/wp-content/uploads/2019/08/NWQSR-2006-2013.pdf (2013).
- Rola, A. C., Pulhin, J. M. & Hall, R. A. Water Policy in the Philippines: Issues, Initiatives, and Prospects. (2018). doi:https://doi.org/10.1007/978-3-319-70969-7.
- Environmental Management Bureau. National Water Quality Status Report (2014-2019)., https://emb.gov.ph/wp-content/uploads/2022/08/Final-National-WQSR-2014-2019_12Oct2020.pdf (2020).
- Department of Environment and Natural Resources. DENR Administrative Order No.2016-08: Water Quality Guidelines and General Effluent Standards of 2016. (2016).
- Sabangan, A. R. & Testa, B. A dead river — in pictures. Philippine Center for Investigative Journalism vol. 3, https://pcij.org/article/6443/a-dead-river-in-pictures-2 (2021).
- Asian Development Bank & Blacksmith Institute. Reducing Mercury and Heavy Metals Contamination in Meycauayan River. https://www.adb.org/results/water-pda-reducing-mercury-and-heavy-metals-contamination-meycauayan-river (2009).
- Department of Environment and Natural Resources. DENR Administrative Order No.2021-19: Updated Water Quality Guidelines (WGS) and General Effluent Standards (GES) for Selected Parameters. (2021).
- Pleto, J. V. R., Migo, V. P. & Arboleda, M. D. M. Preliminary Water and Sediment Quality Assessment of the Meycauayan River Segment of the Marilao-Meycauayan- Obando River System in Bulacan, the Philippines. J Health Pollut 10, 200609 (2020)., https://pubmed.ncbi.nlm.nih.gov/32509410/
- Diwa, R. R. et al. Meycauayan, an industrial city in Bulacan, Philippines: Heavy metal pollution in soil and surface sediments and their relationship to environmental indicators. Preprints (Basel) (2021) doi:10.20944/preprints202106.0439.v1., https://www.preprints.org/manuscript/202106.0439/v1/download
- Cormack, R. Sediment Quality Guideline Options for the State of Alaska. (2001)., https://dec.alaska.gov/media/12116/sediment-quality-options.pdf
- Malenab, Ma. C. T. et al. Analysis of the Integrated Water Resource Management in a Water Quality Management Area in the Philippines: The Case of Meycauayan-Marilao-Obando River System. Journal of Environmental Science and Management 19, 84–98 (2016)., https://ovcre.uplb.edu.ph/journals-uplb/index.php/JESAM/article/view/148/130
- Philippine Statistics Authority. Compendium of Philippine Environment Statistics 2010-2019. (2022)., https://psa.gov.ph/sites/default/files/5-%28ons-cleared%29_CPES%202010-2019%20Publication_31March_ONS-signed.pdf